 |
|
Budget 1998-99: President Rodin's Report to the University
Council
The goals and strategies that drive the budget are grouped below,
and the first four pie charts on this page [ pie
1 | pie
2 | pie
3 | pie
4 ] show how funds are spent, while displays further below [
pie 5
| pie
6 | table
1 | table
2 | graph
1 | graph
2 | graph
3 | graph
4 ] indicate sources of income. Just
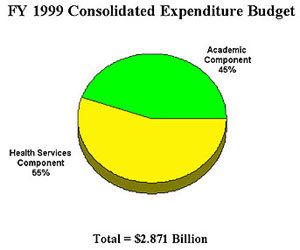
below: Academic expense is 45% of the total budget. Below right, the
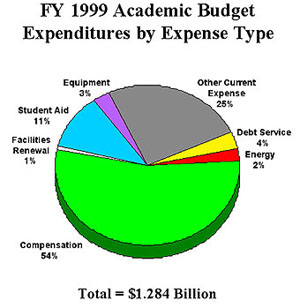
series of pies shows (a)
that compensation accounts for 54% of expense; (b)
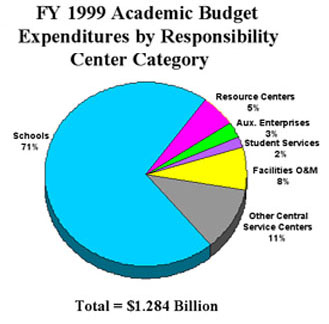
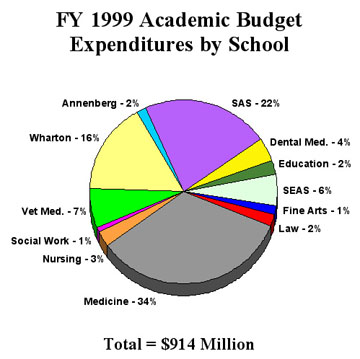
that the bulk of spending is done through the schools; and (c)
the breakdown by schools. Note: All tables, graphs and charts, and text
blocks featuring bullets are from Dr. Rodin's slides. Text blocks in italics
have been added from notes.
Components of the Consolidated University Budget
- The Consolidated University budget has two major components--"Academic"
and "Health Services."
- The Academic budget includes:
- --Schools (including the School of Medicine)
- --Resource Centers [Library, etc.]
- --Auxiliary Enterprises
- --Central Service Centers
- The Health Services budget includes all components of UPHS except
for the School of Medicine:
- --Hospital of the University of Pennsylvania (HUP)
- --Presbyterian Medical Center (PMC)
- --Pennsylvania Hospital
- --Phoenixville Hospital
- --Clinical Practices of the University of Pennsylvania (CPUP)
- --Clinical Care Associates (CCA)
|
 |
Budget Planning Parameters
|
| |
FY 1999 |
FY 2000 |
- Undergrad & Grad Group Tuition
|
0.045 |
0.042 |
|
|
0.045 |
0.042 |
|
|
0.03 |
0.014 |
|
|
0 |
0.035 |
- Total undergraduate Charges
|
0.039 |
0.037 |
- Sponsored Programs: Indirect Cost Recovery Rate
|
0.595 |
0.585 |
- Spending Rate Under Spending Rule Policy*
|
0.047 |
0.047 |
* 3-year average lagged 1 year |
- Attain comprehensive excellence and secure Penn's position as one of
world's premier research and teaching universities.
- Secure greater research funding and new sources of support.
- Restructure, improve and cut costs of administration.
- Invest in strategic master's and continuing education programs that
can generate revenue.
- Enhance government and community relations programs essential to Penn's
best interests.
- Increase Penn's international reach and global perspective.
- Creatively deploy new technologies.
- Effectively communicate Penn's contributions to the media and the University's
various constituencies.
- Raise the funds required to support Penn's strategic goals.
- Life Sciences, Technology & Policy
- American & Comparative Democratic & Legal Institutions
- Management, Leadership & Organizations
- The Humanities--Meaning in the 21st Century
- The Urban Agenda--Penn in Philadelphia
- Information Science, Technology & Society
How the University's Budget Supports the Goals and Priorities of the
Agenda for
Excellence
- Provost and Deans work together to develop School budgets that maximize
level of resources available for investment in strategic goals and priorities.
- Executive Vice President and Vice Presidents work together to develop
Central Service Center budgets that maximize level of resources available
for investment in strategic goals and priorities.
- Limited central resources--e.g., Subvention, Research Facilities funding,
Facilities Renewal Program funding--are directed wherever possible towards
investments in the Schools that support their most important goals and
priorities and the Agenda
for Excellence.
Penn's Financial Planning Approach
- The University engages in strategic long-term financial planning.
- New programs, priorities and initiatives are discussed and planned
long before they are included in the annual University operating budget.
- Consultation occurs through the Academic Planning & Budget Committee
and in other forums.
- New initiatives that will be implemented and budgeted in Penn's Fiscal
Year 2000 budget have been identified and publicized already--during the
current year or prior years.
Examples of Strategic Initiatives in Penn's FY 2000 Budget
- American/Democratic Institutions--new Political Science faculty appointments
- Computer and Information Science--new faculty/facilities (IAST II)
- Management--Huntsman Hall--new facilities to support new approaches
to management education
- Undergraduate Experience: College Houses--Quad Renovation/ Expanded
Living Learning Programming
- Undergraduate Experience: Experimental College/Expanded Freshman Seminars
- Undergraduate/Graduate Experience: Opening of Perelman Quad (Houston,
Irvine, Silfen)
- Undergraduate Experience: Recreation--Pottruck Health & Fitness
Center/ Bower recreation field/Murphy baseball field
- Quality of Life/Neighborhood Initiatives: Hamilton Square; Westside
Common
- Life Sciences: Opening of BioMedical Research Building (BRB) II-III
- Undergraduate and graduate financial aid increases
|
 |
 |
 |
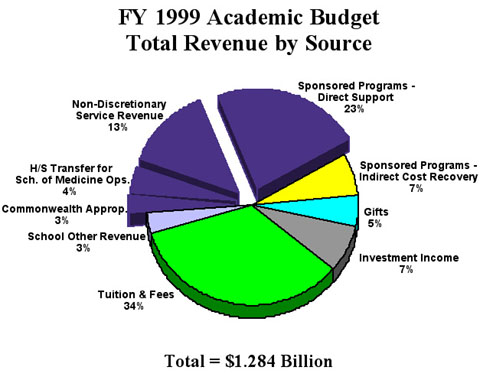
| At
right, the sources of revenue for the Academic Budget. A related pie
chart, below,
shows that only 49% of income is discretionary (from tuition, investment
income, and gifts)--but much of it only technically so, Dr. Rodin pointed
out. Tuition and fees, the largest slice of the income pie, will rise less
in the coming year than they did in the current one, according to the planning
parameters (below) being used for preparation of the 1999-2000 budget. Details
on tuition and overhead income are farther
below, and Penn's endowment is shown here. |
 |
|
 |
Tuition (above
and below)
In the early 80s Penn's tuition & fee increase figure spiked to
15.9%, then took a jagged but largely downward path to arrive at this year's
increase figure of 4.2%. This makes Penn's increase the lowest of the Ivies
that have so far reported their increases for 1999-2000. |
Peer Institution Undergraduate Charges
Comparison
|
|
1999-2000 Total
|
% Change vs. 1998-99
|
Tuition & Fees
|
Room & Board
|
|
| Brown |
$32,280 |
3.9% |
$25,186 |
7,094 |
| Harvard |
32,164 |
3.3% |
24,407 |
7,757 |
| Chicago |
32,069 |
3.7% |
24,234 |
7,835 |
| Georgetown |
31,988 |
3.6% |
23,295 |
8,693 |
| Dartmouth |
31,983 |
3.8% |
24,774 |
7,209 |
| Yale |
31,940 |
2.9% |
24,500 |
7,440 |
| M.I.T. |
31,900 |
3.6% |
25,000 |
6,900 |
| Duke |
31,839 |
3.2% |
24,751 |
7,088 |
| Cornell (End.) |
31,675 |
4.1% |
23,848 |
7,827 |
| Princeton |
31,599 |
3.5% |
24,630 |
6,969 |
| Penn |
31,592 |
3.7% |
24,230 |
7,362 |
| Johns Hopkins |
31,530 |
3.9% |
23,660 |
7,870 |
| Washington U. |
31,357 |
5.5% |
23,634 |
7,723 |
| Stanford |
31,095 |
4.1% |
23,214 |
7,881 |
| Northwestern |
30,413 |
4.2% |
23,566 |
6,847 |
Note: Columbia has not yet announced student charges. |
|
Research Overhead Recovery (below)
[ graph
1 | graph
2 | graph
4 ]
When a research grant is funded, it comes in two parts: the direct
support of the work, plus a percentage called "indirect cost recovery,"
to pay for the rise in overhead costs such as electricity, maintenance,
and the like. As shown in the Budget Planning Parameters at the top of the
page, the base rate is expected to decrease from 59.5% in the current year
to 58.5% in 1999-2000. At Council, Dr. Peter Freyd asked if it is true that
the University actually loses money on some sponsored research and Dr. Rodin
replied that this is so. She said efforts are being made in Washington to
rectify this.


Endowment
Penn ranks high among the nation's major institutions, President Rodin
showed at Council with the first
of the two tables below. But, moving to the second
table, she said the endowment per student is the figure that presents
a challenge. Income on investments is one of the discretionary slices in
the revenue pie chart [here].
In the Budget Planning Parameters [shown
here], the Spending Rule Policy set by Trustees permits spending each
year from endowment earnings an amount equal to 4.7% of the three-year average
market value of the endowment, lagged one year.
Top Twenty Endowments as of June 30, 1998
|
#
|
Institution
|
Assets ($000)
|
| 1 |
Harvard University |
$13,019,736 |
| 2 |
Texas System, University of |
7,647,309 |
| 3 |
Yale University |
6,624,449 |
| 4 |
Princeton University |
5,582,800 |
| 5 |
Emory University |
5,104,801 |
| 6 |
Stanford University |
4,559,066 |
| 7 |
California, University of |
3,787,884 |
| 8 |
M.I.T. |
3,678,127 |
| 9 |
The Texas A&M University System and Foundations |
3,531,517 |
| 10 |
Washington University |
3,445,743 |
| 11 |
Columbia University |
3,425,992 |
| 12 |
Penn |
3,059,401 |
| 13 |
Rice University |
2,790,627 |
| 14 |
Cornell University |
2,527,871 |
| 15 |
Northwestern University |
2,397,715 |
| 16 |
Chicago, University of |
2,359,358 |
| 17 |
Michigan, University of |
2,303,054 |
| 18 |
Notre Dame, University of |
1,766,176 |
| 19 |
Vanderbilt University |
1,539,242 |
| 20 |
Dartmouth College |
1,519,708 |
Peer Institution Endowment/Student Among
Top 20 Endowments
as of June 30, 1998
|
Institution
|
Assets ($000)
|
($/Student)
|
| Princeton |
5,582,800 |
875,321 |
| Harvard |
13,019,736 |
727,522 |
| Yale |
6,624,449 |
612,015 |
| M.I.T. |
3,678,127 |
377,980 |
| Stanford |
4,559,066 |
348,579 |
| Washington U |
3,445,743 |
346,028 |
| Dartmouth |
1,519,708 |
292,815 |
| Chicago |
2,359,358 |
209,181 |
| Columbia |
3,425,992 |
188,791 |
| Northwestern |
2,397,715 |
159,221 |
| Penn |
3,059,401 |
155,941 |
| Cornell |
2,527,871 |
134,877 |
Dr. Rodin's coda:
How Penn is Achieving its Goals in Light of Serious Fiscal Constraints
- Efficiency: Both in Central Service Centers and in administration of
Schools
- Development: Ambitious, successful, focused fundraising in support
of goals and priorities of the Agenda
for Excellence
- University/Private Sector Partnerships: Getting others to spend their
money to do things Penn needs so that our own resources can be spent on
core academic priorities
More on Budget: The University's budget
year begins July 1. The budget for FY2000 will be reviewed and approved
by the Trustees at their June 18 Stated Meeting. Copies of the FY2000 budget
will be available from the Budget Office (898-6651) after the meeting.
Almanac, Vol. 45, No. 31, May 4, 1999
FRONT
PAGE | CONTENTS
| JOB-OPS
| CRIMESTATS
|
| FOR COMMENT:
Proposal for a Center for Cognitive Neuroscience |
| FOR
COMMENT: Final Report of the Working Group on Alcohol Abuse |
| TALK
ABOUT TEACHING | BETWEEN
ISSUES | MAY at PENN
|
|
|