| Report to the Penn Faculty on the Migration to the Online Course Evaluation System |
|
,
|
In the spring of 2009, Penn introduced a new online, web-based system for students to evaluate their courses. In order to aid instructors in understanding the course evaluation data collected in spring and fall of 2009, I asked a group of administrators involved in the project to prepare a report about differences in course ratings that resulted from the introduction of the new online system.
I would like to thank the following people for their work on this report:
Stacey Lopez, Assistant Vice President for Institutional Research and Analysis
William McManus, Director of Institutional Research, School of Arts and Sciences
Rob Nelson, Director for Education, Office of the Provost
Emily Sabato, Associate Director of Student Information and Clinical Contracts, School of Nursing
Daniel Shapiro, IT Director, Information Systems and Computing
Deborah Bolton Stagg, Director of Data Administration and Institutional Research, Wharton School
Erin Visalli, Senior Systems Analyst, Information Systems and Computing
—Andrew N. Binns, Vice Provost for Education
Background
Student course evaluations within Penn’s undergraduate schools have traditionally been collected via a paper and pencil system. Evaluation forms were distributed during a class meeting at or near the end of the semester. These forms were collected, scanned and subsequently summarized. After a pilot study carried out during fall 2008, a new online, web-based system was introduced to the Penn community in the spring of 2009. This new Online Course Evaluation System completely replaced the pencil and paper system that preceded it.1
Purpose of this Report
There are numerous differences between the traditional paper and pencil collection method and the Online Course Evaluation System. The purpose of this short report is twofold. First, it explains the major differences between the traditional and new administration methods of course evaluation. Second, the report presents selected findings about observed differences in course ratings as a result of introducing the new online system.
Overview of the Online Course Evaluation System
No changes were made to the content of the survey instrument; that is, the questions that appeared on the new Online Course Evaluation were identical to those given on the traditional paper form. This consistency better facilitates a comparison between the course evaluation administration methods.
While the course evaluation questionnaire remained completely unchanged, there are marked differences in the distribution of the questionnaire via the two administration methods. In addition to introducing the online method of collection, the new system made two substantive changes to the way the survey was administered:
1) The period of evaluation, or the evaluation window, was greatly lengthened. Traditionally, an evaluation form was distributed to a class section at or near the end of the semester; students not present on evaluation day would simply miss the opportunity to evaluate the course. The evaluation period for online administration began on April 20 and concluded on May 15, a period spanning the last week of classes as well as the final exam period.
2) An online “grade pathway” was instituted to encourage students to complete course evaluations. When a student logged on to check his or her final grade in a course, he or she was prompted to either complete the Online Course Evaluation or to opt out of the course evaluation prior to grade retrieval. 2
Major findings
Finding #1:A greater proportion of students completed course evaluations as a result of introducing the Online Course Evaluation System
Students participated in the new online system at a significantly greater rate than in previous years. The participation rate for the Online Course Evaluation was 90.76% in the spring term of 2009 and 85.38% for fall 2009.3 Over the past ten years, participation rates using the traditional paper and pencil administration have been between 70% and 75% for the undergraduate schools. 4
Finding #2:There was a slight decrease in the overall mean score for course quality rating and instructor quality rating
The average quality rating decreased significantly when using the online system compared to the traditional paper and pencil administration of the past. The possible responses for course quality for both the paper and web version of the survey are as follows: Poor (0), Fair (1), Good (2), Very Good (3), and Excellent (4). The average course quality rating for all courses in spring 2009 was 2.8 compared to 3.0 for all courses in spring 2008.
Table 1: Course Evaluation Participation Rates, Spring Semesters 1994-2009 5
Term |
SAS |
SEAS |
Nursing |
Wharton |
Undergraduate
Schools
Average |
University
Average |
1994A |
67.9 |
65.3 |
72.2 |
81.0 |
71.6 |
67.9 |
1995A |
71.2 |
64.1 |
63.3 |
- |
66.2 |
69.9 |
1996A |
71.4 |
66.9 |
71.6 |
- |
69.9 |
70.9 |
1997A |
69.8 |
66.4 |
75.5 |
- |
70.6 |
70.0 |
1998A |
71.7 |
67.4 |
78.1 |
60.0 |
69.3 |
72.0 |
1999A |
69.7 |
62.7 |
75.7 |
94.4 |
75.6 |
69.3 |
2000A |
67.9 |
61.2 |
71.1 |
90.0 |
72.5 |
67.5 |
2001A |
74.7 |
64.6 |
73.7 |
73.7 |
71.7 |
73.5 |
2002A |
74.8 |
67.8 |
69.0 |
73.6 |
71.3 |
73.6 |
2003A |
76.9 |
67.6 |
69.5 |
75.0 |
72.3 |
75.3 |
2004A |
75.7 |
73.4 |
72.6 |
75.0 |
74.2 |
75.0 |
2005A |
74.3 |
73.1 |
77.4 |
74.6 |
74.8 |
74.5 |
2006A |
74.9 |
73.8 |
65.1 |
77.0 |
72.7 |
74.8 |
2007A |
75.4 |
75.1 |
68.3 |
75.2 |
73.5 |
74.8 |
2008A |
74.9 |
77.4 |
70.4 |
74.2 |
74.3 |
74.6 |
2009A |
91.1 |
93.5 |
93.0 |
90.1 |
91.2 |
90.8 |
To investigate how individual faculty might anticipate their average quality ratings to change as a result of the new online system, a t-Test for paired differences was completed. 6 Mean quality ratings were compared for all courses that had both the same instructor and the same course ID in the spring term of 2008 and the spring term of 2009. The average differences observed, while statistically significant, were practically small. The average course quality, holding instructors and sections constant, decreased by .16 from spring 2008 to spring 2009. Hence faculty should anticipate a slight decrease in mean scores relative to prior semesters.7 The same is true for the average instructor quality mean score, which decreased by .14 from spring 2008 to spring 2009. 8
Finding #3:The increase in participation rates in larger classes was not a significant factor in the overall decrease in average quality rating
Instituting the “grade pathway” increased participation rates considerably, especially in large lecture courses. Historically, participation rates in the course evaluation process were around 75%. This rate varied greatly with class size: smaller classes had a rate closer to 100% and larger classes closer to 50%. To examine if the large jump in participation experienced in large classes compared to small classes had an influence on scores, the mean course quality score by class size was calculated.
The difference in mean score was less for courses with more than 100 students than for courses with fewer than 100 students. This suggests that the increase in participation rates in very large classes was not a major factor in the overall decrease in the course quality score.
Table 2: Comparison of Average Course Quality Ratings by Class Size for Courses Evaluated Spring 2008 vs. Spring 2009
|
Spring 2008
Paper Forms |
Spring 2009
Web Distribution |
|
Class Size
(Number of Enrollments) |
Number
of Classes |
Average
Rating |
Number
of Classes |
Average
Rating |
Rating
Difference |
Very Small (10 or fewer) |
654 |
3.28 |
756 |
3.08 |
0.20 |
Small (10-24) |
1,191 |
3.03 |
1,567 |
2.83 |
0.20 |
Medium (25-49) |
454 |
2.89 |
465 |
2.62 |
0.27 |
Large (50-99) |
335 |
2.69 |
284 |
2.46 |
0.23 |
Very Large (100 or more) |
80 |
2.68 |
73 |
2.56 |
0.12 |
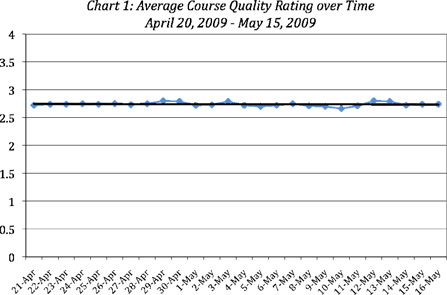
Finding #4: Average quality rating scores were not significantly impacted by extending the evaluation window
One substantive change to the administration of the survey was the extension of the evaluation window to include the final exam period. To evaluate the impact of this extended evaluation window on course quality scores, the mean daily course score was plotted for the evaluation window (see chart below). The daily variability in mean quality rating over the evaluation period was quite small. This suggests that expanding the evaluation window did not have a significant impact on the overall quality rating scores.
Endnotes
1 Both the Schools of Medicine and Law have separate online systems and did not utilize the Online Course Evaluation System. The School of Dental Medicine, the School of Veterinary Medicine, and Biomedical Graduate Studies did not utilize the Online Course Evaluation System during the spring term of 2009, however it is anticipated these groups will use the online system in the future.
2 On May 14, a software vulnerability was uncovered that could permit a student to access their grades prior to completing their faculty/course evaluations. This software flaw was addressed within an hour of its discovery. Unfortunately we are unable to determine how many students availed themselves of this opportunity during the window in which the vulnerability existed. We do know that on over 200,000 accesses, the system responded as intended and prevented students with outstanding evaluations from obtaining grades. We are confident that the issue has been addressed and will not recur in the future.
3 Because students were asked to either complete a course evaluation or to opt out of the evaluation, it is necessary to make a distinction between the response rate and the participation rate. The Online Participation Rate is defined as:
Online Participation Rate for a Section = |
Number of Students Responding to the Course Quality Question |
Total Final Enrollment in the Selection |
4The participation rate for the traditional paper and pencil delivery mechanism is defined as:
Traditional Participation Rate for a Section = |
Number of Paper Forms Submitted |
Total Final Enrollment in the Selection |
5 School of Arts and Sciences Institutional Research
6 The ratings for quality of course are closely correlated to the ratings for other questions on the evaluation. Therefore, for purposes of this analysis, the quality of course ratings serve as a proxy for other questions on the evaluation.
7 t-Test for Significance—Average Course Quality Rating Paired, Common Instructor/Course Matches Spring to Spring Terms 2006-2009
This analysis examines the effect on average course quality rating that occurred as a result of transitioning from a paper-based course evaluation system to the new Online Course Evaluation System. Using the set of individuals who taught identical courses in the spring of 2008 and 2009, a t-Test for paired differences was constructed to determine if the course evaluation mechanism (paper vs. online) resulted in a significant change in the average course quality rating.
The average differences observed, while statistically significant, were practically small. Similar paired t-Tests were employed to determine if results significantly differed when the administration method remained constant. That is, comparisons were made between spring 2007 and spring 2008, as well as between spring 2006 and spring 2007. Over this period, the only evaluation method available was the traditional paper and pencil system. No significant differences were detected when comparing course quality ratings for instructors when the administration mode remained constant. The results of these tests suggest that faculty should expect a slight decrease in the mean course quality rating for their courses as a result of introducing the Online Course Evaluation System.
Spring 2008 vs. Spring 2009 (paper vs. online) |
|
2008A |
2009A |
Mean |
3.08 |
2.92 |
Variance |
0.300 |
0.337 |
Observations |
199 |
199 |
Hypothesized Mean Difference |
0 |
|
df |
198 |
|
t Stat |
5.16 |
|
P(T<=t) two-tail |
< 0.001*** |
|
|
|
|
Spring 2007 vs. Spring 2008 (paper vs. paper) |
|
2007A |
2008A |
Mean |
3.09 |
3.10 |
Variance |
0.280 |
0.312 |
Observations |
165 |
165 |
Hypothesized Mean Difference |
0 |
|
df |
164 |
|
t Stat |
-0.07 |
|
P(T<=t) two-tail |
0.942 |
|
|
|
|
Spring 2006 vs. Spring 2007 (paper vs. paper) |
|
2006A |
2007A |
Mean |
3.07 |
3.08 |
Variance |
0.301 |
0.292 |
Observations |
160 |
160 |
Hypothesized Mean Difference |
0 |
|
df |
159 |
|
t Stat |
-0.33 |
|
P(T<=t) two-tail |
0.745 |
|
8 t-Test for Significance—Average Instructor Quality Rating Paired, Common Instructor/Course Matches Spring to Spring Terms 2006-2009
This analysis examines the effect on average instructor quality rating that occurred as a result of transitioning from a paper-based course evaluation system to the new Online Course Evaluation System. Using the set of individuals who taught identical courses in the spring of 2008 and 2009, a t-Test for paired differences was constructed to determine if the course evaluation mechanism (paper vs. online) resulted in a significant change in the average instructor quality rating.
The average differences observed are similar to the differences observed for course quality rating (detailed in endnote 7 above). Similar to course quality rating, the results of these tests suggest that faculty should expect a slight decrease in the mean instructor quality ratings for their courses as a result of introducing the Online Course Evaluation System.
Spring 2008 vs. Spring 2009 (paper vs. online) |
|
2008A |
2009A |
Mean |
3.30 |
3.16 |
Variance |
0.240 |
0.302 |
Observations |
199 |
199 |
Hypothesized Mean Difference |
0 |
|
df |
198 |
|
t Stat |
4.68 |
|
P(T<=t) two-tail |
< 0.001*** |
|
|
|
|
Spring 2007 vs. Spring 2008 (paper vs. paper) |
|
2007A |
2008A |
Mean |
3.31 |
3.31 |
Variance |
0.229 |
0.248 |
Observations |
165 |
165 |
Hypothesized Mean Difference |
0 |
|
df |
164 |
|
t Stat |
0.186 |
|
P(T<=t) two-tail |
0.853 |
|
|
|
|
Spring 2006 vs. Spring 2007 (paper vs. paper) |
|
2006A |
2007A |
Mean |
3.31 |
3.29 |
Variance |
0.245 |
0.259 |
Observations |
160 |
160 |
Hypothesized Mean Difference |
0 |
|
df |
159 |
|
t Stat |
0.586 |
|
P(T<=t) two-tail |
0.559 |
|
|