The budget reflects several important institutional priorities. Among them is a continued decline in the rate of increase in student charges to 4%; support for enhancements to the technology infrastructure through the ResNet project, the Library's Access 2000 project, FinMIS, and school-based initiatives; a salary policy that ensures the competitiveness of faculty salaries; enhancement of deferred maintenance; support for need-blind admissions and undergraduate financial aid; and support for new public safety initiatives.
The budget also reflects the administration's goal to contain administrative costs. The core budgets of the administrative units continue to decline in real terms as cost savings of $2.7 million are included as a result of initial restructuring efforts. As restructuring and reengineering processes continue, it is expected that significant additional savings will be realized over time.
As in past years, there are assumptions included in the budget that contain some degree of risk. In particular, Penn's federal indirect cost recovery rate is still under negotiation with the Department of Health and Human Services. The budget is constructed with the FY 95 rate of 63.5%.
As approved by the Trustees, the budget planned for Commonwealth Appropriation is $35,542,000, the amount received in FY 95, plus special Commonwealth funding of $308,000 for the Museum and HUP. Since that time, the Commonwealth has approved an FY 96 appropriation of $35,470,000, $72,000 less than the amount budgeted, plus $313,000 in special funding for the Museum and HUP. Of greater importance is the fact that $5,928,000 from the University's General Instruction line item was transferred to the School of Veterinary Medicine. This initiative indicates the Commonwealth's interest in providing continued support for Pennsylvania's only school of veterinary medicine.
As the University carefully positions itself for the 21st Century, this budget reflects the challenges and opportunities that lie ahead.
-- Barry Stupine, Acting Executive Director
Office of Resource Planning and Budget
It is important to note, the budget for the School of Veterinary Medicine, although balanced, reflects the University's agreement to underwrite $1.6 million of costs as the School works to achieve longer term stability that was disrupted by the loss of Commonwealth funds. This $1.6 million is not recognized in the budget and will be managed against the University operating performance similar to the two previous years. In FY 1994 and FY 1995 the University underwrote $2.0 million and $1.6 million, respectively.
As shown on Schedule A, the total University budget reflects a reduction to fund balance of $15.2 million in FY 1996. This reduction to fund balance is primarily the result of the capital and academic programs in the School of Medicine Budget supported by transfers of resources from HUP and CPUP. These actions have been reviewed by Trustees in past years and are expected to continue. A difference in presentation, however, is that the Health Services budgets for HUP, CPUP, CCA, and MSO are presented in accordance with Generally Accepted Accounting Principles (GAAP) for health care institutions. These principles require that depreciation be recognized as an expense of operations, but not capital additions and retirement of long-term debt.
Beginning in FY 1996, GAAP for colleges and universities will change in several important ways. New accounting standards issued by the Financial Accounting Standards Board will result in changes to our FY 1996 financial statements that will make them look dramatically different than they do today. The University's new financial statements will appear more like the financial statements presented by the health system. The impetus for change arose from demands from resource providers and governing boards who, for some time, have sought more meaningful and "readable" financial statements. The budget presented here does not conform to these changes, due largely to timing issues associated with these pronouncements, but also the nature of the changes requires considerable analysis and review prior to formal adoption and this effort is not yet complete. Some of the major changes include:
On the non-health side of the budget, allocating resources for strategic programs and initiatives continues to be important for the Schools and Centers of the University. For FY 1996, however, the level of central resources (sub-vention) allocated to the Schools and Centers has diminished considerably from past years. This has meant that the deans must look more to their school-based resources to make programmatic investments and to meet ongoing budget obligations. A record low increase in student charges, combined with increased costs for financial aid, deferred maintenance, and other fiscal needs, have heightened an awareness of the trade-offs that are necessary to close the budget. They have also served as a focal point to help Penn begin institutional re-engineering and to define more clearly our academic priorities. The challenge of crafting this budget was to create strategies and plans for individual schools that permit deans to invest in targeted areas without causing long-term structural imbalances.
Tuition: For Fiscal Year 1996, University undergraduate and graduate tuition rates are increasing 5.6%, the lowest increase in over 25 years. Although special program tuition and tuition charged by the professional schools are governed more by market forces than by University policy, most of these charges are increasing by the University parameter. Exceptions to this are the School of Social Work and the Nursing School where tuition rates are increasing 9.1% and 8.3%, respectively, to gradually move these rates to equal the University rate. For comparative purposes the undergraduate rates charged by the other schools, including the Ivy Leagues schools, are shown in Table 1.
Total budgeted tuition and fees revenue, as seen on Schedule A, reflects an increase of 5.1%. This increase is a result not only of the University policy on tuition rate increases, but also assumptions about the number of students projected for both undergraduate and graduate programs. For the entering freshman class, an admissions target of 2,300 is used, including 1,480 for Arts and Sciences, 380 for Wharton, 360 for Engineering and Applied Science, and 80 for Nursing. This target is below last year's target by about 50 students. Graduate enrollments in Nursing are expected to increase consistent with the school's strategic plan to yield a graduate tuition increase for this school of over 13%. The remaining graduate and professional programs are anticipating very modest or no increases in class size.
Health System: The continued growth and success of the UPHS is reflected not only in the budgets of HUP, CPUP, CCA, and MSO, but also in the academic budget of the School of Medicine. Most notable is the cross subsidization through transfers to the Medical School to support its operating budget and capital program. For FY 1996, these transfers are budgeted to total $68.1 million, a 5.7% increase from FY 1995. Within the transfer line, $22.5 million is being used to support Medicine's operating budget, with the remainder being used to support the school's capital program.
Salary Policy: The Salaries and Wages line on Schedule A reflects an increase of 6.3% for unrestricted salaries, the result of several important resource allocation decisions that were guided by institutional directives.
The principle guiding our salary planning for the 1996 fiscal year is to protect the academic quality of the University to the greatest extent possible in part by maintaining faculty salaries that are competitive with our peer institutions and continuing the emphasis on salary increases for staff that insure competitiveness across the institution as well as with the external market. With this in mind, we have recommended that within a 3.5% pool, salaries increase in the range of 2.0% to 7.0%.
Although individual faculty salary decisions are made at the school level, with deans issuing to department chairs their own guidelines regarding resource constraints, certain uniform standards have been established to which all deans must adhere:
The Provost will review the deans' faculty salary recommendations prior to their release to insure that raises on average are in keeping with market conditions for their disciplines. The deans also will consult with the Provost regarding any recommendations to provide less than a 2.0% or more than a 7.0% salary increase.
For non-academic personnel, salary policy also provides for a 3.5% increase pool for eligible personnel within a 2.0% to 7.0% range. To meet this requirement, many units have found it necessary to engage in cost containment initiatives as available budget resources are increasing by less than the 3.5%. The administrative centers, in particular, have received budget allocations that fund about 2.0% of their need, with the remaining 1.5% coming from cost reductions, position eliminations, and attrition.
The results of these policies and directives are unrestricted academic salaries growing by 8.9% and non-academic salaries growing by 4.9%. For the faculty, excluding the Medical School, the growth is divided as follows: 3.8% for the general salary pool; 1.1% for promotions, tenure and market adjustments; 1.1% for new appointments; and 2.4% to account for fewer faculty going on leave and a loss of grant support. For staff, the breakdown is as follows: 3.3% for the general salary pool; 0.9% due to program growth primarily in the Nursing and Medical Schools; and 0.7% as a reserve for program stabilization, including reserves for staff separations and allowances for restructuring.
Financial Aid: The unrestricted undergraduate financial aid budget is targeted to increase by 6.0% over the FY 1995 projection and amounts to $46.3 million. This cost is largely a result of our commitment to need-blind admissions and the escalating cost of providing aid packages that are competitive with peer institutions. This cost also includes $2.25 million for the Mayor's Scholarship program. Unrestricted funding for aid is targeted from five sources: 1) a charge to the unrestricted budget of the schools to cover $39.7 million, or 85.7% of the total; 2) University resources of $4.37 million will fill the funding gap left after the designation of school funds; 3) the Nursing School has augmented its contribution to the financial aid budget for its students by $394,000; 4) a contribution of $866,000 from the tuition earned by the Office of International Programs paid by Penn students studying abroad; 5) and $1.0 million collected on student receivables that had been written off is planned to be applied to the aid budget. The combined impact of the unrestricted allocations for financial aid is that about 25 cents of each undergraduate tuition dollar in FY 1996 is used for financial aid. In addition to unrestricted funds, only about $2.5 million is planned to be available from the endowment to cover a total undergraduate aid budget of $48.7 million. This lack of significant endowment for aid is a primary driver of the growth in our dependency on tuition to cover this cost.
Administrative Restructuring: In January 1995, the recommendations to restructure the University issued by Coopers & Lybrand were presented to the campus community. As a first phase of restructuring, the report issued broad reforms and suggestions for cost and service improvements, primarily in the Executive Vice President's area. The areas included in this initial phase were Business Services, Facilities Management, Finance, Human Resources, Information Systems and Computing, and Public Safety. Some recommendations in the Coopers & Lybrand report have already been acted upon and they include:
Consultation is an integral part of the process of developing implementation plans for the recommendations contained in Penn's administrative restructuring project. By its very nature, successful restructuring demands involvement and participation from the personnel across disciplines who serve on teams charged with developing specific plans, the University governance bodies who contribute ideas and expertise to the process, and the customers who bring the process full circle with their input and evaluation. Wherever appropriate, we have sought to involve in project teams and task forces members of our faculty and staff with expertise in those areas. The consultative process will continue to play an important role in restructuring at Penn as the implementation plans are developed and carried out.
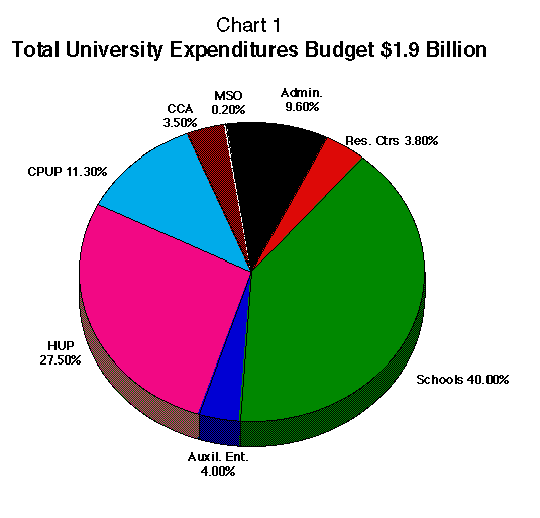
Chart 1 illustrates the distribution of total University expenditures. HUP, CPUP, CCA, and MSO together comprise the largest segment of the budget (42.5%) followed by the Schools (40.0%). The proportion of the budget for Schools has declined over the past few years, due to the more rapid growth in the Health Services component. The Health Services growth is driven not only by HUP and CPUP operations, but also by the additions of CCA and MSO in recent years. In total, the school expenditures are scheduled to grow 5.9%.
Chart 1 also shows that Resource Centers make up 3.8% of the FY 1996 budget. These budgets total collectively $72.4 million. There are seven Resource Centers at the University which make up this category: Annenberg Center, Department of Recreation and Intercollegiate Athletics, Provost Interdisciplinary Center, Institute of Contemporary Art, Morris Arboretum, Library, and the University Museum. The Library's growth stands out in this group due to acquisition investments, as well as continued technology investments through the Access 2000 program.
Auxiliary Enterprises comprise $76.7 million, or 4.0% of the total University budget in FY 1996. The four primary units accounted for in this category are the University Residential System, Dining Services, Parking, and the Bookstore. The Residential System has been the focus of University attention recently as greater emphasis has been placed on moving to full occupancy. The income generated by the Residential System is budgeted to increase by less than 1.0%, due almost exclusively to the decision to hold the average rates at their FY 1995 levels. The Dining Services budget too has been held to a frozen rate structure and its revenue is budgeted to grow by about 1.0% and is due exclusively to a projected increase in volume.
The final category shown on Chart 1 is Administration which accounts for $183.1 million of the FY 1996 total University budget. This category includes central University administrative offices, the utility, housekeeping, and maintenance costs of our facilities, as well as student services. In FY 1996, Administration comprises 9.6% of the total budget.
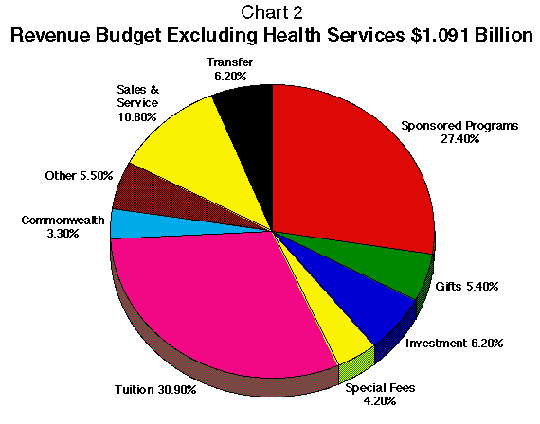
Chart 2 shows the University unrestricted and restricted budget without the Health Services component. For FY 1996, this totals $1.091 billion, an increase of 5.2% over FY 1995, and includes transfers of $68.1 million to the School of Medicine from HUP and CPUP. Overall, the University's FY 1996 unrestricted revenue is projected to increase by 4.5%. Most of this growth is the direct result of the growth of tuition revenue, but is also driven by the 10.3% growth of indirect cost recoveries in the School of Medicine. Restricted resources are budgeted to grow 6.8%, and include revenue from endowment funds, gift funds, and sponsored programs.
Tuition continues to account for the largest source of revenue, 30.9%. The budget is based on an increase of 5.5% in the tuition and fees for undergraduates and 5.6% for graduate students. For the upcoming fiscal year, the Trustees have approved undergraduate tuition of $17,974 and fees of $1,924; tuition and fees total $19,898, an increase of $1,042 over the FY 1995 rate.
Sponsored Programs, projected to comprise 27.4% of next year's budget, remain the second largest revenue source. This category represents awards from external sponsors for both direct and indirect expenditures for research programs and contractual obligations undertaken by University faculty. The School of Medicine accounts for over one-half of the sponsored programs dollars awarded to the University. Other schools with significant sponsored program activity include Arts and Sciences, Engineering and Applied Science, Veterinary Medicine, Nursing, and Education.
The primary sponsor of funded research at Penn is the Department of Health and Human Services (DHHS). DHHS awards account for about 59.0% of the sponsored program dollars. The second largest federal sponsor is the Department of Education with about 6.0% of the sponsored program dollars. The National Science Foundation (NSF) also provides significant support with about 5.2% of the dollars. Total Federal sponsorship of sponsored programs is about 79.0% with the remaining 21.0% coming from state and local governments, foundations and associations, and private industry.
Indirect costs are a significant part of the cost of conducting research at large research-oriented universities. These costs represent the expenditures made by a university for utilities, maintenance, library, and administrative costs, both central and school based. The federal government will reimburse universities through federally sponsored grants for the portion of indirect costs related to research. Penn has entered into negotiations with our cognizant agency (DHHS) in order to determine our indirect cost rate for FY 1996. For FY 1995, this rate was 63.5%. This rate is applied to the Modified Total Direct Costs (MTDC) of an award (excludes equipment, facilities renovation/construction, and subcontracts) to determine the amount the University will be reimbursed. The University's indirect cost rate after FY 1996 remains uncertain; it will depend not only on the outcome of the negotiations between the University and DHHS, but also on the outcome of federal policy aimed at reducing indirect research dollars from the federal budget. The budget is constructed assuming that there is no significant change to our current rate.
Chart 2 shows that Commonwealth funding accounts for 3.3% of the University's budget excluding Health Services. The budget assumes that Commonwealth funding will remain fixed at the FY 1995 level, although a final outcome is dependent on a vote of the legislature which generally occurs after the University budget is closed. Table 2 below shows our appropriation for the last two years and the planned FY 1996 amount. In addition to this, the University budget assumes continued special funding for Cardiovascular Studies in the School of Medicine ($132,000), the University Museum ($176,000), and the Morris Arboretum ($400,000).
As seen in Chart 2, the Investment category makes up 6.2% of the University budget excluding Health Services in FY 1996. This represents income that is available for expenditures from funds held in the University's endowment, the Associated Investments Fund (AIF), non- pooled endowment held in trust by external agencies, and short term earnings on cash balances. The University's endowment held in the AIF had a market value of $1.195 billion at April 28, 1995 with each share having a market value of $571.30. Endowment funds not held in the AIF total about $444.7 million. Thus, the total market value of Penn's endowment was approximately $1.640 billion on April 28, 1995, a $175.2 million increase from a year ago.
Funds held in the AIF are subject to a spending rule policy that governs the amount of income available for expenditures. The policy for FY 1996 provides for a distribution equal to 5.0% of the three-year average of the per share market value of the AIF, lagged by one year. This is lower than the 5.2% used in the previous year and 5.5% two years ago. The distribution of income earned by funds holding shares in the AIF is expected to be $19.70 per share for FY 1996. With the lower spending rule, about 11.4% of earned income will be reinvested, increasing the number of shares by 0.7%.
Unrestricted sales revenue is projected at $118.4 million, or 10.8% of the University's FY 1996 budget excluding the Health Services. This revenue is generated largely by room and board charges in the Residences and Dining Services. Other programs generating significant sales dollars include the clinics in the Veterinary School and the Dental School, the Bookstore, Parking, and ticket sales in Athletics and the Annenberg Center for Performing Arts.
The Other Income category, accounting for 5.5% of the FY 1996 budget, contains support from the School of Medicine's Teaching and Administration Fund, a 2% contribution by the Clinical Practices to Medicine's unrestricted budget, and a reimbursement from the Howard Hughes Medical Institute for space it occupies in the Clinical Research Building.
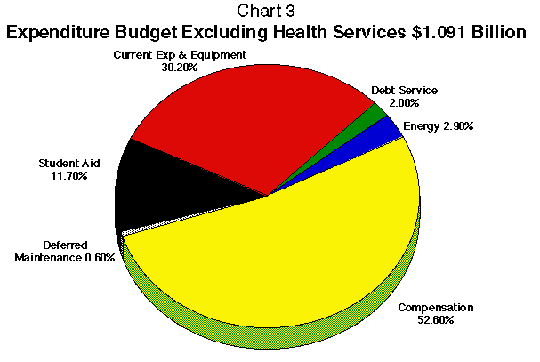
Chart 3 illustrates how the revenues from Chart 2 will be spent. Compensation is the largest expenditure component of the budget, accounting for 52.6% of total expenditures. The general salary pool increase for FY 1996 is 3.5% of the current salary base for eligible faculty and staff. This is similar to the prior year and will be funded by unrestricted and restricted resources. The employee benefits rates are 32.5% for full-time employees and 10.8% for part-time employees compared to 32.7% and 11.0% in FY 1995. Salary growth on the unrestricted budget is 6.3% and on restricted funds is 5.4% for combined growth of 6.0%.
As Chart 3 shows, current expense and equipment purchases account for the second largest component of University expenditures, 30.2%. This component, while driven to some extent by general inflation, also includes the cost of our planned expansion in research activity, the cost of acquiring new technology, and expenditures for capital acquisitions, construction, and renovations.
For many years, the fastest growing portion of the University budget has been financial aid. Undergraduate and graduate financial aid accounts for 11.7% of FY 1996 budget excluding Health Services. The undergraduate financial aid budget for FY 1996 is $48.7 million and represents a 6.7% increase over FY 1995 projected expenditures for both unrestricted funds and designated endowment income. Funding from the individual unrestricted school budgets accounts for 95% of the aid budget, while endowment income accounts for only 5%. For FY 1996, the subvention pool will again provide funding, but at $4.37 million compared to $4.86 million in FY 1995. Over the next four years, this subvention subsidy will be eliminated and the full burden of unrestricted aid will be borne by the school budgets. To help mitigate the impact of this transfer, deans are encouraged to raise endowment and other restricted funds.
Graduate financial aid continues to be a priority for the University, and $8.0 million for Graduate Fellowships and $3.5 million for Research Assistantships will be made available in FY 1996 from subvention resources. This represents an increase of 5.6% over FY 1995. In addition to General University Resources, the individual schools will contribute approximately $24.4 million for unrestricted graduate student aid, a 5.9% increase.
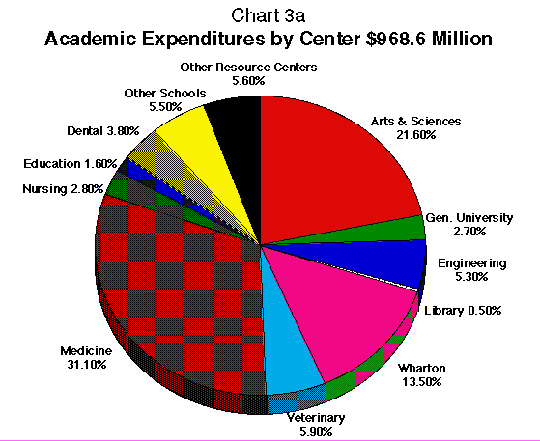
Chart 3a represents the University's academic expenditures only and illustrates the comparative size of the major academic units. This presentation includes Schools, Resource Centers, and General University Resources. Academic expenditures total $968.6 million, or 51.0% of the total University budget for FY 1996. As can be seen, the School of Medicine is the largest academic enterprise within the University followed closely by the School of Arts and Sciences. For a more detailed description of school and resource center programs, see the individual center narratives in Appendix A [available for examination at the Office of Resource Planning and Budget, and at other locations indicated on page S-8 of this Supplement].
The budget of the Library continues to feel pressure to deliver services while managing to the realities of tight budgets. For FY 1996, the program component of the Library budget was increased 8.6% to provide resources for two of its highest priorities: additional support for the acquisitions budget where costs continue to grow more rapidly than general inflation and increased funding to cover the annual debt service associated with the Access 2000 project. With its allocated costs, the total Library budget is increasing 7.6%, and this cost is funded nearly exclusively by the schools.
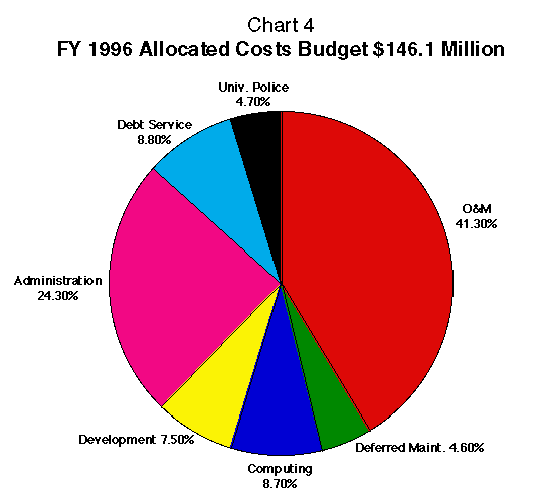
The budget for Administration is targeted to increase 4.0% and will total $146.1 million. Chart 4 illustrates the breakdown of these dollars by administrative units. Within the 4.0% growth, specific issues have been addressed, including a 10% increase in the funds allocated for deferred maintenance, increased debt service requirements, increased support for public safety initiatives, and additional funds to pay down the cost of the recently completed development campaign. In addition, administrative centers are required to fund the 3.5% salary pool with only 2.0% of the costs provided in the budget. The 1.5% differential means that $934,000 must be identified in the budgets of these units. Furthermore, cost reductions totaling $1.8 million are included in these budgets for a total cost reduction of $2.7 million. Overall, the support for baseline operations is increasing only 1.8%.
An important decision made was to continue to lower the rate of increase in student charges. For FY 1996, total undergraduate charges will increase by only 4.0%, the lowest increase in over 25 years. Key to this result was the decision to hold the average dining and residential charges at the FY 1995 levels while initiating plans to move the residences to full occupancy.
The budget continues to reflect the administration's goal to contain the growth of administrative costs. The core budgets of the administrative units continue to decline in real terms and cost savings of $2.7 million were generated as a result of initial restructuring work. As the overall restructuring initiatives proceed ahead, it is expected that over time significant savings will be achieved. The FY 1996 budget, however, does not yet fully reflect these savings.
As in past years, there are assumptions from which budgets have been developed that contain a degree of risk. First, the budget presumes that our Commonwealth appropriation will be funded at the FY 1995 level. Since it is not likely that the Commonwealth budget will be fully resolved before the University's budget must be adopted, there remains the possibility of a change in this revenue stream. Second, Penn's indirect cost rate, the rate at which the federal government will reimburse universities for the indirect costs of their research enterprises, is still under negotiation with the Department of Health and Human Services. The budget is constructed with the FY 1995 rate of 63.5% remaining in effect.
Lastly, the University is necessarily operating much closer to the margin than it has in many years. This leaves little room to respond to unforeseen events. As a result, President Rodin has mandated that new projects and programs be approved only if new dollars are identified or if existing resources are reallocated from other areas. At the same time, the President has insisted that key priorities be addressed, including Public Safety, Technology Investments, Deferred Maintenance, Undergraduate Financial Aid, and Competitiveness of Faculty Salaries.
University of Pennsylvania Operating Budget, FY
1995 and 1996
                                       FY 1995      FY 1996    Percent
                                       Projection   Budget    Change

UNRESTRICTED & RESTRICTED

Unrestricted      Revenues
                    Tuition & Fees    364,837      383,523      5.1%
                    Commonwealth
                    Appropriation      35,850       35,850      0.0%
                    Investment Income  20,121       18,656     -7.3%
                    Gifts              14,083       14,050     -0.2%
                    Indirect Cost
                    Recoveries         81,518       86,807      6.5%
                    Sales &
                    Services          114,829      118,404      3.1%
                    Other Sources      11,849       13,729     15.9%

                       Total Revenues 643,087      671,019      4.3%

                   Expenditures
                    Salaries &
                    Wages             277,686      295,137      6.3%
                    Employee Benefits  83,556       88,084      5.4%
                      Total
                      Compensation    361,242      383,221      6.1%
                    Current Expense
                       Energy          32,646       31,499     -3.5%
                       Debt Service    20,132       21,930      8.9%
                       Deferred
                       Maintenance      6,185       6,801      10.0%
                       Current Expense
                       & Equipment    170,938     167,927      -1.8%
                         Total Current
                         Expense      229,901     228,157      -0.8%<
                    Student Aid
                       Undergraduate   43,679      46,320       6.0%
                       Graduate &
                       Professional    33,844      35,862       6.0%
                         Total
                         Student Aid   77,523      82,182       6.0%
                           Sub-total
                           Expenditures
                                      668,666     693,560       3.7%
                             Excess
                             Revenues
                            (Expenditures)
                                      (25,579)    (22,541)
                    School of Medicine
                    Capital Program    38,828      45,532      17.3%
                         Total
                         Expenditures 707,494     739,092       4.5%
                    Intra-Health System
                    Transfers from HUP, CPUP
                    for School of Medicine
                        Operations     25,579      22,541
                        School of Medicine
                        Capital
                        Program        38,828      45,532
                           Net Increase
                           (Decrease) in
                           Fund Balances    0           0

Restricted  Revenues & Expenditures
                     Grants &
                     Contracts        214,501     228,302     6.4%
                     Endowments        36,791      38,040     3.4%
                     Gifts             34,560      40,185    16.3%
                     Other Restricted  44,182      45,856     3.8%
                         Total        330,034     352,383     6.8%
                             Net Increase
                            (Decrease) in Fund
                            Balances        0           0


Total Unrestricted & Restricted
                   Revenues           973,121   1,023,402     5.2%
                   Expenditures     1,037,528   1,091,475     5.2%
                     Transfers        64,407      68,073
                        Net Increase
                       (Decrease) in Fund
                       Balances             0            0

HEALTH SERVICES
Hospital of the University of Pennsylvania
                   Revenues          579,275     588,435      1.6%
                   Expenditures      479,146     522,246      9.0%
                      Excess Revenues
                      (Expenditures) 100,129      66,189
                    Intra-Health System
                    Transfers to School
                    of Medicine      (52,668)    (53,912)
                    Intra-Health System
                    Transfers to CPUP,
                    CCA, MSO         (44,707)    (32,225)
                      * Net Increase
                      (Decrease) in Fund
                      Balances         2,754     (19,948)


Clinical Practices of the University of Pennsylvania
                   Revenues          208,877     221,857      6.2%
                   Expenditures      200,340     215,278      7.5%
                       Excess Revenues
                       (Expenditures)  8,537       6,579
                     Intra-Health System
                     Transfers to School
                     of Medicine     (11,739)    (14,161)
                     Intra-Health
                     System Transfers
                     from HUP         20,000           0
                        * Net Increase
                        (Decrease) in Fund
                        Balances      16,798   (7,582)


Clinical Care Associates
                   Revenues           30,564      49,692     62.6%
                   Expenditures       39,753      66,337      66.9%
                      Excess Revenues
                      (Expenditures)  (9,189)    (16,645)
                    Intra-Health System
                    Transfers
                    from HUP          24,707      25,725
                      * Net Increase
                      (Decrease) in Fund
                      Balances        15,518       9,080


Management Services Organization
                   Revenues                        1,128
                   Expenditures                    4,330
                       Excess Revenues
                       (Expenditures)              (3,202)
                    Intra-Health System
                    Transfers from HUP              6,500
                       * Net Increase
                       (Decrease) in Fund Balances   3,298


Total Health Services
                   Revenues          818,716     861,112      5.2%
                   Expenditures      719,239     808,191    12.4%
                      Excess Revenues
                     (Expenditures)   99,477      52,921
                    Intra-Health System
                    Transfers         (64,407)     (68,073)
                      * Net Increase
                      (Decrease) in Fund
                       Balances       35,070      (15,152)

TOTAL UNIVERSITY
Total University
                   Revenues          1,791,837   1,884,514     5.2%
                   Expenditures      1,756,767      1,899,666     8.1%
                      Excess Revenues
                      (Expenditures)    35,070     (15,152)
                    Intra-Health System
                    Transfers                0           0
                      Net Increase (Decrease)
                      in Fund Balances  35,070      (15,152)
See Footnote to Schedule B [p. S-8 of this
Supplement]
Tuition and Fees
              Tuition    Room &    Tuition & Fees     Percent
              & Fees     Board     Total              Change

Penn          $19,898    6,966     26,864             4.0%
Brown         $20,292    6,864     27,156             5.4%
Cornell, End. $20,066    6,600     26,666             5.4%
Dartmouth     $20,910    6,129     27,039             5.1%
Harvard       $20,865    6,710     27,575             5.1%
Johns Hopkins $20,250    6,955     27,205             6.5%
M.I.T.        $21,175    5,975     27,150             4.1%
Princeton     $20,960    6,116     27,076             4.9%
Stanford      $19,695    7,054     26,749             5.0%
U. Chicago    $20,193    7,258     27,451             4.1%
U. Rochester  $19,165    6,730     25,895             4.3%
Yale          $21,000    6,630     27,630             4.9%
FY 1994 to FY 1996 (Projected1) Commonwealth Appropriation
                                             FY96
                    FY94         FY95        Projected1    Change
Line Item           Appro-       Appro-      Appro-        FY95 to
                    priation     priation    priation      FY96

Instruction       $11,838,000   $15,489,000   $15,489,000     $0
Medical
Instruction         3,326,000     4,280,000     4,280,000     $0
Dental Clinics        773,000       994,000       994,000     $0
* Vet Instruction   7,456,000     7,456,000     7,456,000     $0
* New Bolton Center 2,840,000     4,154,000     4,154,000     $0
* Food & Animal

Clinics             1,529,000     1,968,000     1,968,000     $0
* Center for Animal

Health                934,000     1,201,000     1,201,000     $0

     Total        $28,696,000   $35,542,000   $35,542,0001    $0

     * Total

     Veterinary

     School       $12,759,000   $14,779,000   $14,779,000     $0
1 As noted on page S-1, the actual figure is now known; the total is $35,470,000 ($72,000 less than the amount budgeted), and the distribution was altered as given in the text on S-1.--Ed.
Appendix A presents the School and Center Program Statements in 53 pages, outlining their goals, plans and recent history of revenue and expense.
Appendix B presents Schedule B, showing the University Operating Budget by Summary of Centers (indicating revenues by source and expenditures by category across the University), and Schedule C, showing revenue and expense by School and Center.
The Footnote to Schedule B, referred to on page S-3 of this Supplement, at the end of Schedule A, reads as shown at right.
Footnote to Schedule B: University of Pennsylvania Health Services
Separate budgets for HUP, CPUP, CCA and MSO have been presented to the Health System Trustees in accordance with Generally Accepted Accounting Principles (GAAP) for providers of health care services.
Listed below, we have reflected the net change in fund balances by entity after considering Intra-Health System transfers. These Transfers are being utilized to support the School of Medicine operating budget and capital program. In addition, they are being utilized to fund the start-up and acquisition costs for the primary care physician network and the Management Services Organization.
($ in 000s) HUP CPUP CCA MSO TotalFY1996 budgeted surplus/ (deficit) reported in accordance with Health Care GAAP 68,597 6,579 (16,645) (3,202) 55,329 Intra-Health System Transfers (86,137) (14,161) 25,725 6,500 (68,073) Other Transfers (2,408) 0 0 0 (2,408)
FY 1996 Net Change in Fund Balance (19,948) (7,582) 9,080 3,298 (15,152)
Almanac
Tuesday, December 5, 1995
Volume 42 Number 14